Interactive CPU profiles captured while downloading a 30 GiB file from S3.
Each flamegraph was recorded with perf at 99 Hz.
Click any card to open the full interactive flamegraph.
Performance Summary — Download to RAM (30 GiB)
Event-delivery overhead measures time spent in
__s3_meta_request_event_delivery_task — the FFI crossing point.
C is baseline (100 %).
Native C implementation with zero FFI overhead.
The tiny event-delivery slice (0.04 %) is purely memory management
(aws_s3_request_release), not marshalling.
Serves as the performance ceiling for all other bindings.
🚀 33.5 Gb/s⏱ 7.7 s (2.1× slower)Event delivery: 6.77 %
FFI overhead jumps 169× versus C. Nearly all event-delivery time
(99.4 %) is PyBytes_FromStringAndSize — allocating Python
bytes objects and copying each C buffer into Python-managed memory.
GIL contention and reference counting add further pressure.
🚀 15.7 Gb/s⏱ 16.4 s (4.4× slower)Event delivery: 12.32 %
FFI overhead jumps 308× versus C. The binding creates a Java
byte array (byte[]) for each C buffer,
copying data across the JNI boundary into JVM-managed heap memory.
JNI call overhead and GC tracking compound the cost; 99.6 % of
event-delivery time is pure marshalling.
Note: switching to DirectByteBuffer (zero-copy, analogous
to Python's memoryview) brings Java throughput back to C
levels.
Both Java and Python expose a zero-copy path that hands the application a
view into the C-owned buffer instead of copying the data.
These tests confirm that virtually all of the RAM-download overhead
is avoidable — the FFI cost drops to near-C levels the moment the
copy is eliminated.
Variant
Throughput
Duration
vs C baseline
C(baseline)
69.4 Gb/s
3.7 s
100 %
Java — DirectByteBuffer
65.0 Gb/s
3.96 s
93.7 % ↑ from 23 %
Python — memoryview
60.6 Gb/s
4.25 s
87.3 % ↑ from 48 %
Java — DirectByteBuffer
🚀 65.0 Gb/s⏱ 3.96 svs C: 93.7 %
Java binding updated to return a DirectByteBuffer that
wraps the C-owned buffer directly — no heap copy across the JNI boundary.
Throughput jumps from 15.7 Gb/s to 65.0 Gb/s (4.1×
improvement), nearly matching the native C baseline.
The residual gap (~7 %) is attributable to JNI framing and JVM object
creation, not data copying.
Python binding updated to expose a memoryview into the
C-owned buffer instead of copying into a bytes object.
Throughput jumps from 33.5 Gb/s to 60.6 Gb/s (1.8×
improvement). The remaining gap vs C is primarily GIL acquisition
and CPython interpreter overhead — not data copying.
Caveat: memoryview is zero-copy only while the caller holds the view;
any downstream processing that materialises the data into Python objects
will reintroduce the copy.
Zoomed snapshots of the s_s3_meta_request_event_delivery_task
frame from each flamegraph. The width of the bar is directly proportional
to CPU time — notice how it almost disappears with the zero-copy variants.
Java: byte[] copy (original) vs DirectByteBuffer (zero-copy)
Java — byte[] (original)
Event delivery: 12.32 % · Throughput: 15.7 Gb/s
The s_s3_meta_request_event_delivery_task frame is
wide — nearly all of it is spent creating and copying byte[]
objects across the JNI boundary.
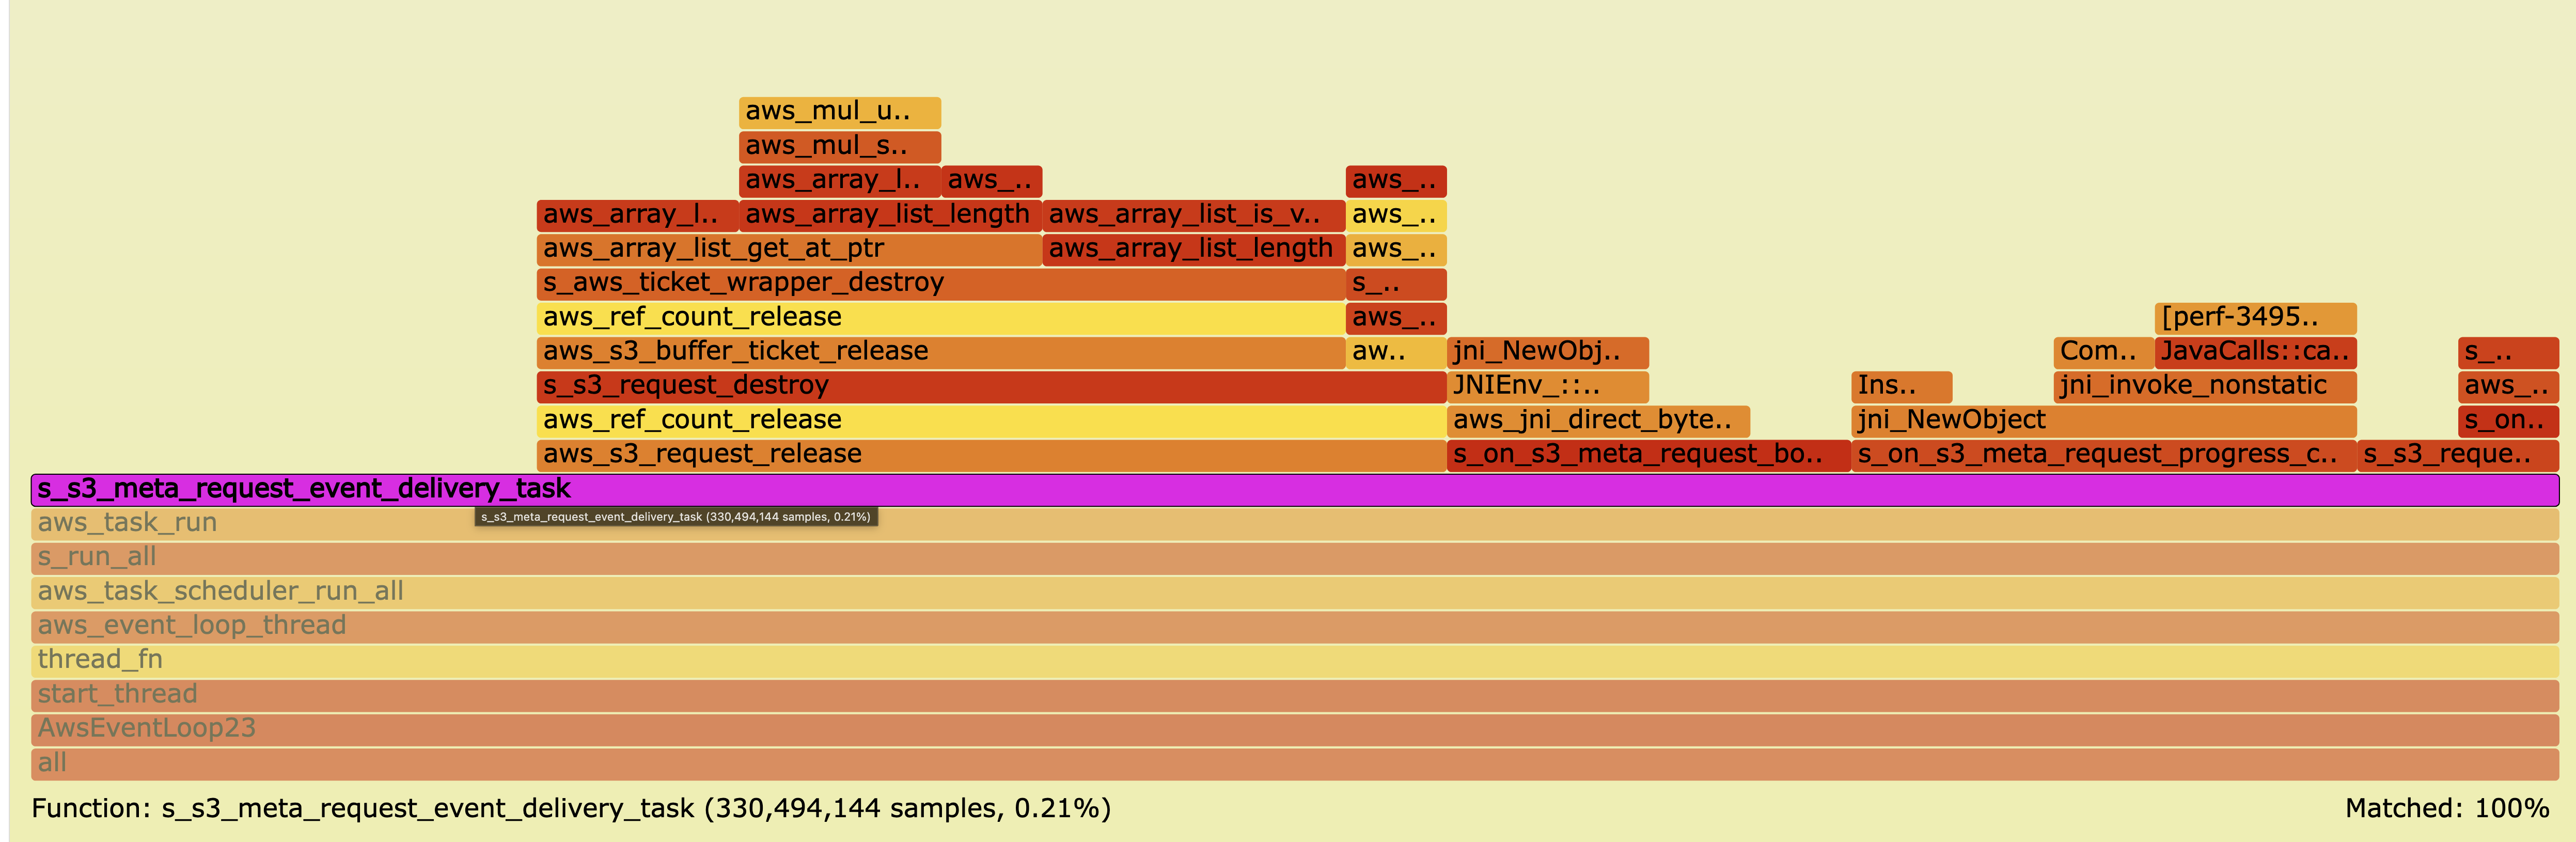
Java — DirectByteBuffer ✨ (zero-copy)
Event delivery: 0.21 % · Throughput: 65.0 Gb/s
The same frame shrinks to a thin sliver — the copy is gone and only
JNI framing + object-header overhead remains.
Python: bytes copy (original) vs memoryview (zero-copy)
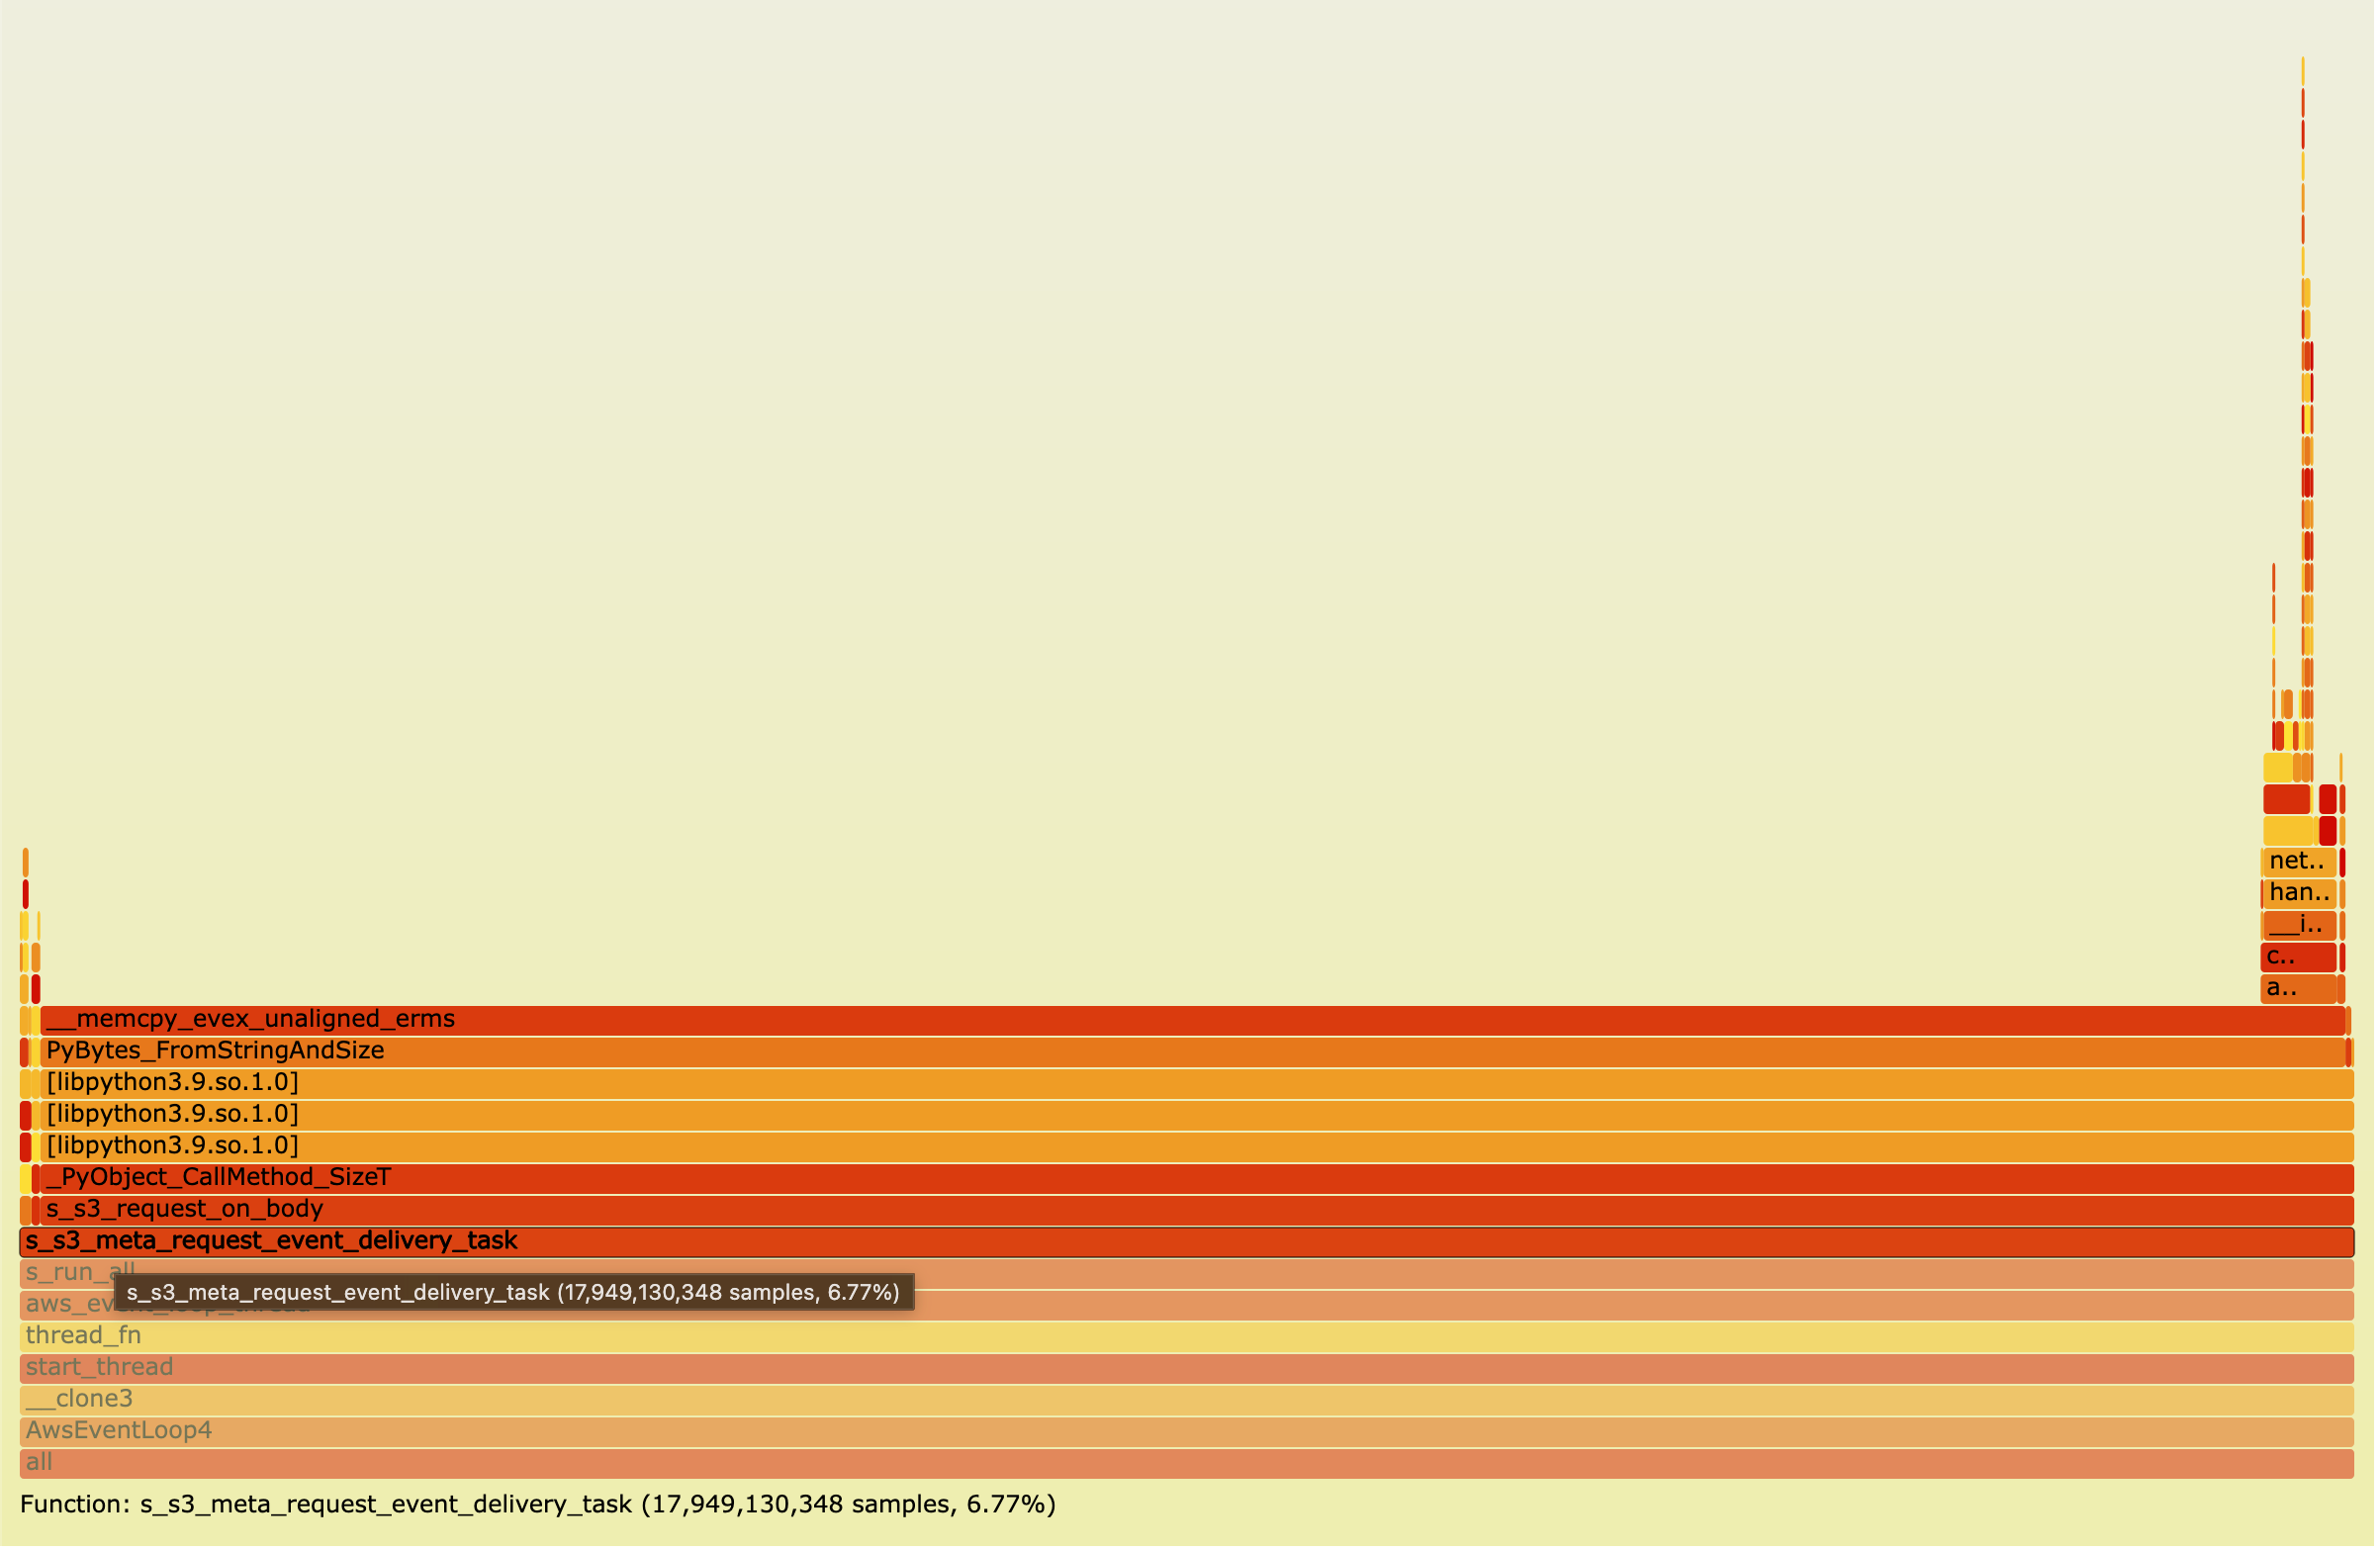
Python — bytes (original)
Event delivery: 6.77 % · Throughput: 33.5 Gb/s PyBytes_FromStringAndSize dominates — each C buffer is
copied into a new Python bytes object on every callback.
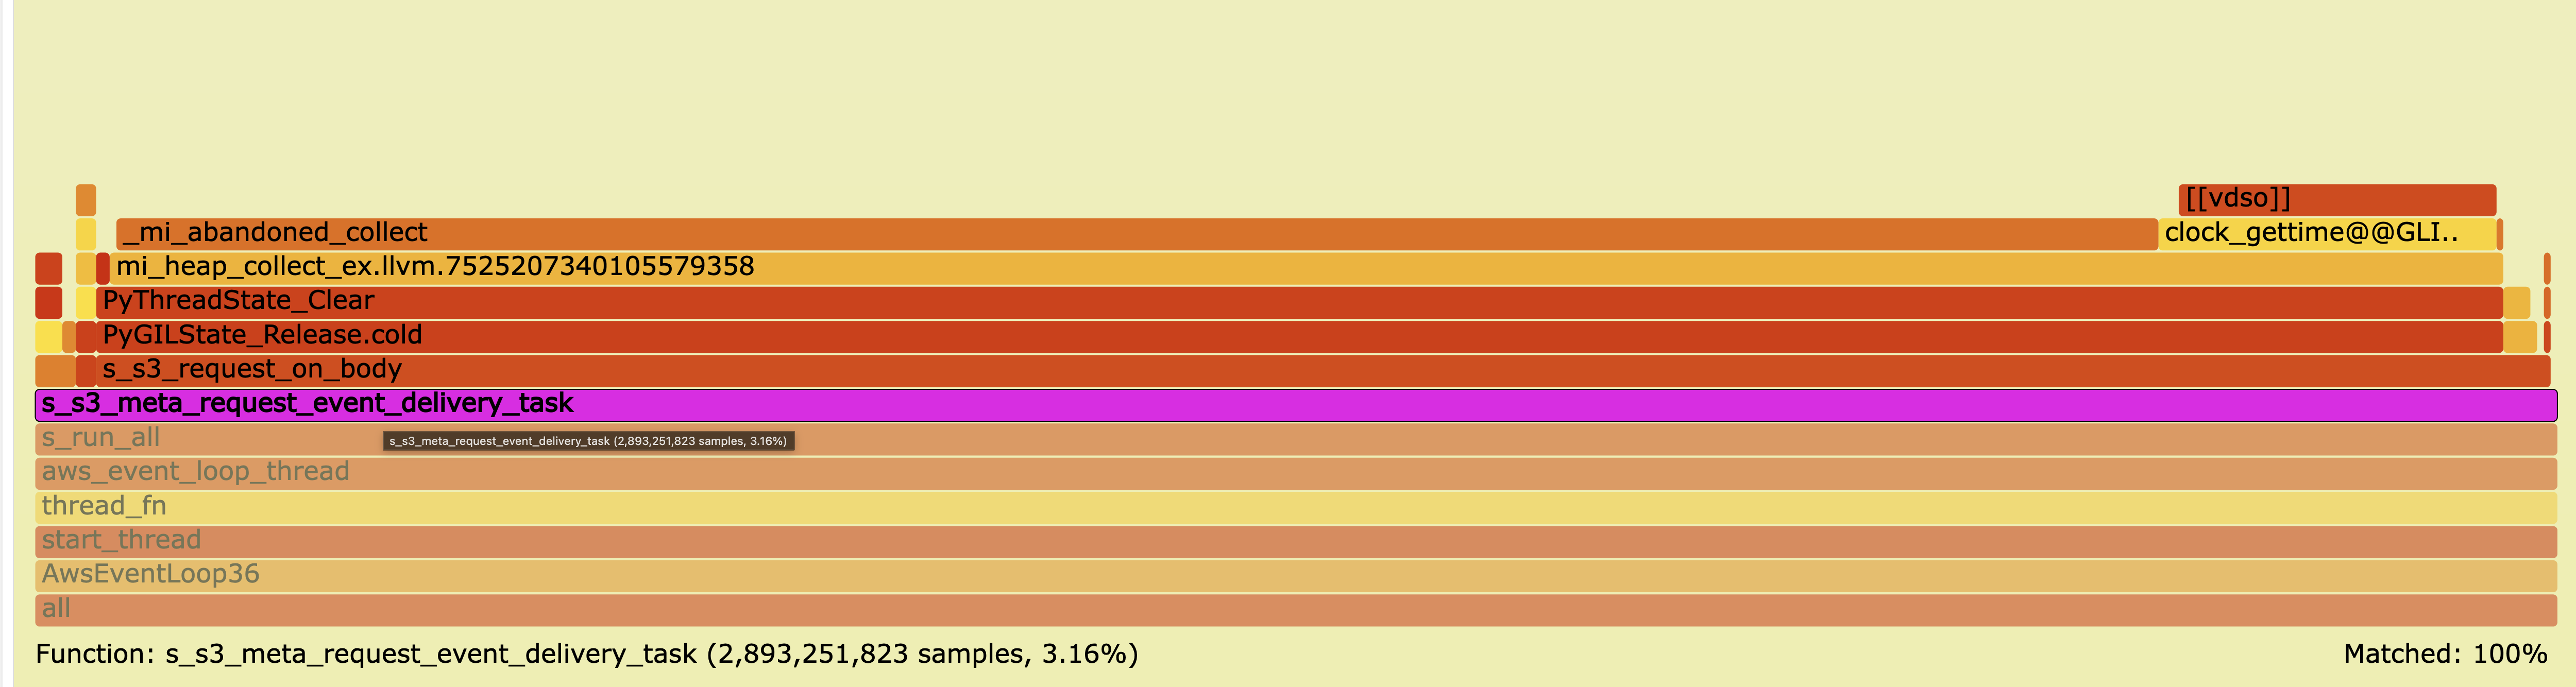
Python — memoryview ✨ (zero-copy)
Event delivery: 3.16 % · Throughput: 60.6 Gb/s
The copy call disappears; remaining overhead is GIL acquisition and
CPython interpreter bookkeeping around the view creation.
Experiment 2 — Control: S3 Download to Disk (5 GiB)
Writing to disk bypasses the application-layer callback entirely; the C runtime
handles I/O without crossing the FFI boundary. All three languages converge to
near-identical throughput, confirming that RAM-download overhead is
caused solely by FFI data marshalling, not by binding infrastructure.
Language
Throughput
Duration
vs C (disk)
C
14.08 Gb/s
3.05 s
100 % (baseline)
Java
14.10 Gb/s
3.05 s
100.1 %
Python
13.05 Gb/s
3.29 s
92.7 %
C — Disk
🚀 14.08 Gb/s⏱ 3.05 s
C writing to disk — sets the disk-I/O bound baseline.
No application callback invoked; all throughput comes from
the CRT's internal write path.
Python writing to disk achieves 93 % of C performance — a dramatic
contrast to the 48 % seen in the RAM-download test.
The 7 % gap is attributable to Python interpreter startup cost
and minor scheduling overhead, not data marshalling.
Java writing to disk matches C throughput exactly.
In the RAM-download test Java reached only 23 % of C — meaning
77 % of Java's overhead is purely FFI marshalling,
eliminated the moment no callback crosses the language boundary.
Each flamegraph was generated from perf record -F 99 --call-graph dwarf
and converted to interactive SVG. The x-axis width is proportional
to CPU time; y-axis height represents call-stack depth.
Colors are arbitrary (no performance meaning).
The critical region to compare across profiles is
__s3_meta_request_event_delivery_task: it is a thin sliver in C
(0.04 %) but dominates the Java profile (12.32 %) and is clearly visible in Python
(6.77 %). Click a frame to zoom; press Ctrl+F to search.
![Java byte[] event delivery flamegraph](java-image.png)